40 Best Infographic Design Ideas to Jumpstart your Creativity - Learn Infographic Design Tutorial


Visme
@vismeappAbout
This is the official channel for Visme. Visme empowers anyone to communicate visually by allowing non-designers to create beautiful engaging Presentations, Infographics, Charts, Reports, Social Graphics and everything in between. Communicate more effectively and promote your product or services with ease. You do not need to be a designer to use Visme; in fact, the hard work is handled by the tool so you can concentrate on creating your content and customizing so it is unique to your needs. With Visme you can Speak Loudly by Speaking Visually. Get to know Visme better by Visiting our site and social profiles.
Latest Posts


Video Description
Are you trying to think outside the box when it comes to your business's designs? These 40 infographic design ideas can help you to create awesome designs that educate your audience and promote your business. Get started today: https://www.visme.co/make-infographics/ --- In this video, Mike from Visme is back to show you various infographic types, examples, and why infographics are one of the best marketing tools out there. Infographics can also be used in teaching, research, and media for better communication and a more powerful impact. This video will show you 40 infographic design ideas you can use depending on your industry, message purpose, and audience. Visit our blog to learn more about infographic ideas and examples: https://visme.co/blog/infographic-ideas/ You can also download Visme’s FREE beginner’s guide on creating amazing infographics from scratch: https://www.visme.co/how-to-make-an-infographic/ Unsure of where to start when it comes to infographic design? Our visual beginner's guide which illustrates several types of infographics, those being: 1. A mixed-chart infographic includes a variety of different charts to show data. 2. A list is mostly text that lists information about a given subject. 3. A timeline looks at how a subject has changed over time. 4. A how-to guide is a step-by-step guide to creating something. 5. A flowchart starts at a single point and branches off based on different decisions. 6. A comparison compares and contrasts two different subjects. 7. A location-based infographic uses a map to look at statistics across a wide range. 8. A photo-graphic uses mostly photographs, combined with text, to explain a point. 9. A hierarchical infographic stacks items or subjects based on a predefined level. 10. A single chart is a chart (such as a bar or line graph) that gives statistics on a subject. 11. Visualized numbers add images to statistics to make them more appealing. 12. An anatomical infographic breaks down what makes something work. 13. A visual resume is a resume in infographic form. Sources: https://blog.adioma.com/author/anna-vital/ https://www.business-management-degree.net/popular-articles/amazon-vs-netflix/ https://www.brandingstrategyinsider.com/2013/10/brands-and-beliefs.html#.XHhQnJNKhTY https://www.entrepreneur.com/article/246768?utm_medium=Social&utm_source=Pinterest https://www.asicentral.com/asp/open/Research/impressionsstudy/Impressions-Study-shirts.aspx https://www.noobpreneur.com/2015/11/11/uk-small-business-startup-guide-for-noobs-like-us-infographic/ https://www.coursehero.com/lit/The-Metamorphosis/infographic/ http://anxietyfreechild.com/ https://www.scmp.com/infographics/article/1862273/infographic-tale-two-economies http://www.studygeek.org/other_lessons/visualizing-pi/ https://popperfont.net/2014/02/24/lovely-science-y-images-by-rachel-ignotofsky/?postpost=v2#content https://futurism.com/images/our-warming-world-the-future-of-climate-change-infographic/?utm_campaign=coschedule&utm_source=pinterest&utm_medium=Futurism&utm_content=Our%20Warming%20World:%20The%20Future%20of%20Climate%20Change%20%5BINFOGRAPHIC%5D https://blog.anthonynolan.org/2015/12/the-most-creative-ways-to-fundraise/ https://www.compassion.com/ https://www.squeaky.com/als-bucket-challenge/ALS-Ice-Bucket-Challenge.html https://www.behance.net/gallery/18185557/Annual-Fund-Infographic https://mashable.com/2011/07/19/tech-companies-infographic/#vEUWFsjItqq2 https://visme.co/blog/visual-content-expert-tips/ http://www.indigoboom.com/ https://www.zerofox.com/blog/vintage-social-media-infographic/ https://www.whoishostingthis.com/blog/2015/01/26/silicon-valley-secrets/ https://www.behance.net/gallery/21538789/Iceberg-_-Visual-resume- https://www.ethos3.com http://www.pbs.org/wnet/nature/siberian-tiger-quest-infographic-all-about-tigers/7844/ https://www.coursehero.com/lit/To-Kill-a-Mockingbird/ http://www.christophniemann.com/portfolio/my-life-in-illustration/ https://www.alamohomes.net/infographic-the-latest-in-mobile-home-sales-data/ https://choozle.com/ https://www.kissmetricshq.com/ https://appliedpsychologydegree.usc.edu/blog/psychology-of-successfully-marketing-to-millennials/ https://www.crowdcompass.com/lp/top-10-myths-of-mobile-event-apps.shtml https://health.clevelandclinic.org/know-your-family-tree-and-improve-your-health-infographic/ https://www.goinvo.com/features/ebola/ https://mic.com/articles/104472/what-sleep-deprivation-does-to-your-brain-in-one-stunning-infographic#.ZpqtyRbaI https://betterworks.com https://www.sireninteractive.com/rare-disease-and-precision-medicine-infographic https://www.researchgate.net/publication/49755442_Restorative_Regeneration_of_Digital_Tips_in_the_African_Clawed_Frog_Xenopus_laevis_Daudin https://www.forbes.com/sites/daviddisalvo/2013/04/02/president-obama-pitches-brain-mapping-project-but-are-we-late-to-the-table/#428f51be45da http://www.outonthefields.com/media/ https://visual.ly/community/infographic/lifestyle/wallet-experiment


![How to Make an Infographic in 5 Steps [INFOGRAPHIC DESIGN GUIDE + EXAMPLES]](https://imgz.pc97.com/?width=500&fit=cover&image=https://i.ytimg.com/vi/uQXf_d5Mgjg/hqdefault.jpg)


![13 Types of Infographics and When to Use Them [+ Templates]](https://imgz.pc97.com/?width=500&fit=cover&image=https://i.ytimg.com/vi/bZc-DjWd2BE/hqdefault.jpg)
Jumpstart Your Design Journey
AI-recommended products based on this video
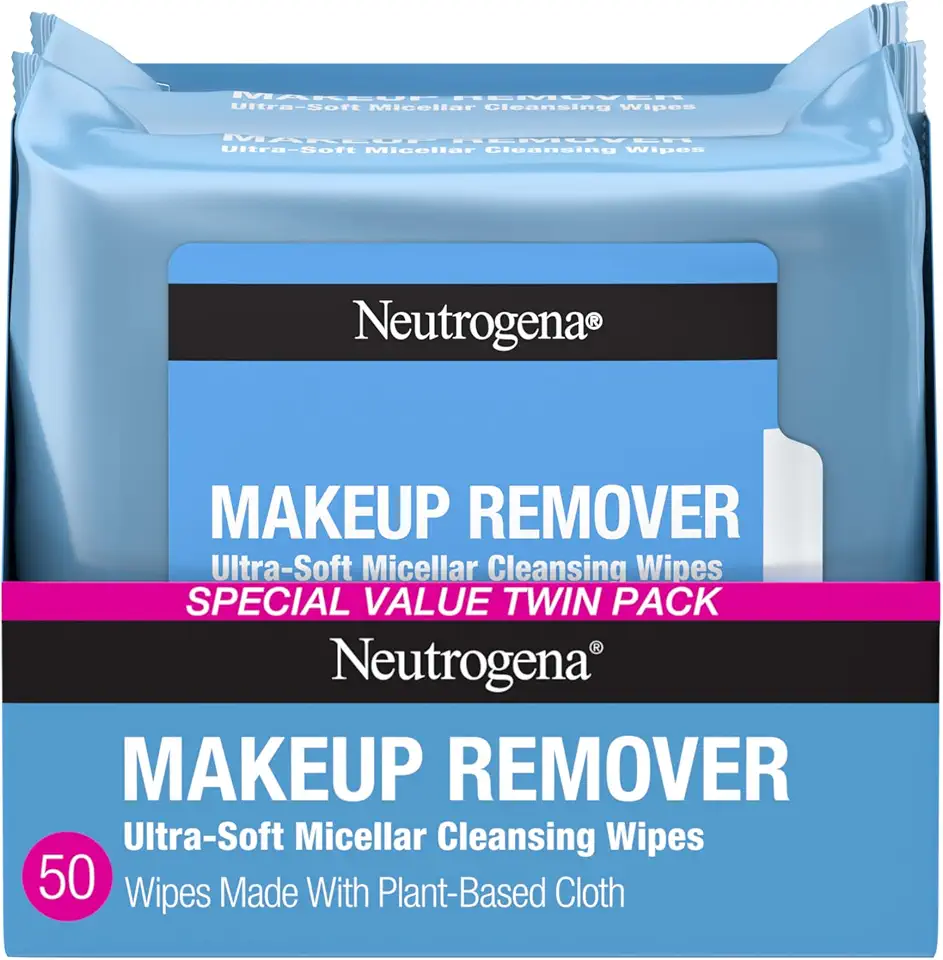
Neutrogena Makeup Remover Wipes Micellar Alcohol-Free Face Towelettes Remove Waterproof Mascara & Oil, Compostable 100% Plant-Based Cloth, Dermatologist & Ophthalmologist Tested, Twin Pack 2 x 25 ct The Forest Stewardship Council

Agfabric 40" x 75 Feet Natural Burlap Fabric Roll,Gardening Burlap Roll,High Density Jute Material for Winter Plants Tree Cover Protection,Weed Barrier,Decorations,Crafts
Neutrogena Makeup Remover Wipes Micellar Alcohol-Free Face Towelettes Remove Waterproof Mascara & Oil, Compostable 100% Plant-Based Cloth, Dermatologist & Ophthalmologist Tested, Twin Pack 2 x 25 ct The Forest Stewardship Council
Agfabric 40" x 75 Feet Natural Burlap Fabric Roll,Gardening Burlap Roll,High Density Jute Material for Winter Plants Tree Cover Protection,Weed Barrier,Decorations,Crafts

TOSY Magnet Pyramid Stone - 1 Cube Transforms into 1 Billion Shapes, 12 Pieces, 243 Rare Earth Magnets, Holographic Design Magnet Tiles Creative Puzzle STEAM Toy, 2-Pack
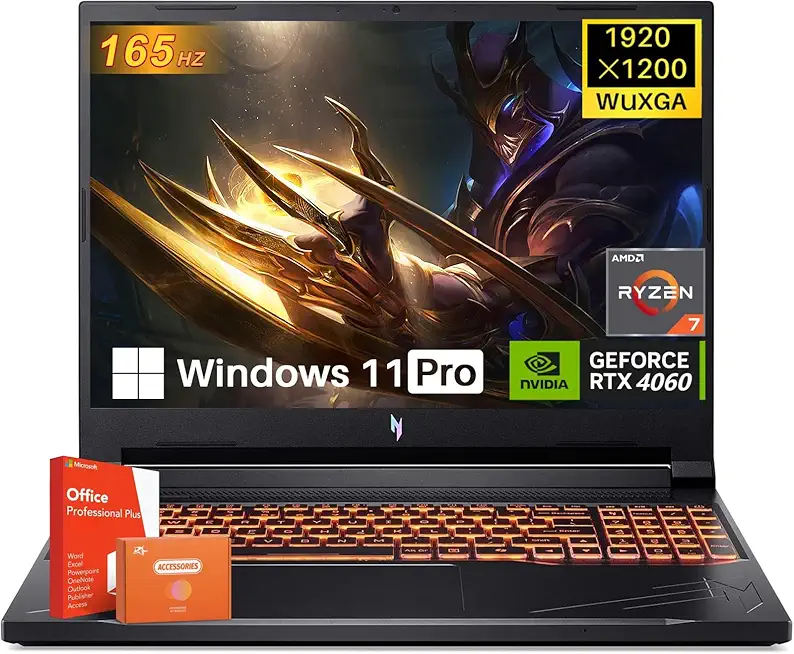
acer Nitro V16 Gaming Laptop, 16" WUXGA 165Hz Display, 8-Core AMD Ryzen 7 8845HS Up to 5.10 GHz, GeForce RTX 4060, 64 GB DDR5 RAM, 4 TB SSD, Backlit Keyboard, Office Lifetime License, Win11 Pro

acer Predator Helios Neo 16 Gaming Laptop, GeForce RTX 4070, Intel i9-14900HX, 16" IPS 240Hz 500 nits Display, 64 GB DDR5 RAM, 4 TB SSD, Windows 11 Pro, Office Pro Lifetime License

MSI Thin 15 Gaming Laptop, 15.6" 144 Hz IPS Display, AMD Ryzen 9 8945HS, NVIDIA RTX 4060 8GB GDDR6, 32 GB DDR5, 2 TB SSD, with Windows 11 Pro, Office Pro Lifetime License, Mouse, USB C Flash Drive
acer Nitro V 15 Gaming Laptop, 15.6" 144Hz FHD Display, Intel 10-Core i7-13620H, NVIDIA GeForce RTX 4060, 64 GB DDR5 RAM, 4 TB SSD, Backlit Keyboard, Microsoft Office Lifetime License, Windows 11 Pro

Book Stand for Reading, Adjustable Book Holder with 360° Rotating Bases, Foldable Designs, and Elastic Clips, Multifunctional Display Stand for Recipe, Cookbooks, Magazines, Tablets, Laptops