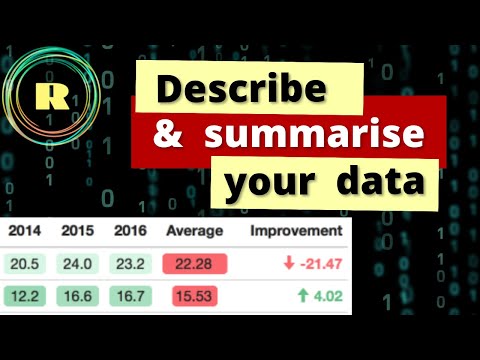
Describe and Summarise your data

R Programming 101
@rprogramming101About
This channel provides teaching videos on data analysis and statistical analysis using R programming. The teaching videos include subjects like data cleaning, data manipulation, data visualization, statistical analysis, and machine learning and AI (artificial intelligence). This channel's content incudes both R programming for beginners and advanced data analysis and visualization.
Latest Posts


Video Description
If you want to learn about to summarise your data by making tables in R or provide descriptive statistics of your dataset, then this video is for you. R programming provides more than one way to summarise and describe your data. You can use base R using, for example, the table() function, for example (and that is covered in this video). I prefer to use the Tidyverse packages that make it much easier (especially if you are a beginner) to create a summary or table. So if you are into data science or just needing to analyse some data, your starting point is descriptive statistics and summary tables before you move on to inferential statistics and modelling your data. This is an R programming for beginners video and I only use datasets that you have each access to. A huge thanks to Nested Knowledge for supporting the creation of this video. I you are doing research of any kind, you'll need to do a literature review. Nested Knowledge allows you to create and share your systematic literature reviews online. Go to: https://nested-knowledge.com
Boost Your Data Analysis Today
AI-recommended products based on this video

Lenovo V15 Laptop | 15.6" FHD Anti-Glare Display | AMD Ryzen 7 7730U | 40GB RAM | 1TB PCIe SSD | HDMI | Type-C | Webcam | Wi-Fi | THUNDEROBOT Wireless Ergonomic Mouse | Windows 11 Pro | Black