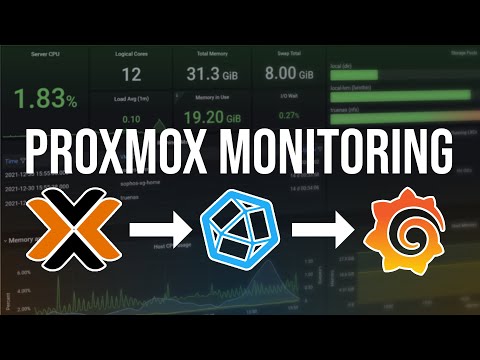
My new Proxmox Monitoring Tools: InfluxDB2 + Grafana

Christian Lempa
View ChannelAbout
IT & Tech Nerd | DevOps and Automation FanBoy For professional inquiries, please contact: [email protected] ______ Legal Notice / Impressum: CL Creative - Christian Lempa c/o Block Services Stuttgarter Str. 106 70736 Fellbach
Latest Posts


Video Description
I recently added some new Monitoring Tools for my Proxmox Server at Home! I installed InfluxDB2 in Docker and used it as an external Metrics Server for Proxmox. Grafana is used to visualize the data in a nice Dashboard. #Proxmox #Grafana #InfluxDB Grafana Dashboard: https://grafana.com/grafana/dashboards/15356 Teleport-*: http://goteleport.com/thedigitallife Follow me: TWITTER: https://twitter.com/christianlempa INSTAGRAM: https://instagram.com/christianlempa DISCORD: https://discord.gg/christian-lempa-s-tech-community-702179729767268433 GITHUB: https://github.com/christianlempa PATREON: https://www.patreon.com/christianlempa MY EQUIPMENT: https://kit.co/christianlempa Timestamps: 00:00 - Introduction 00:50 - My current monitoring setup 02:01 - The new setup 03:16 - InfluxDB2 06:50 - How to secure InfluxDB2? 10:24 - (Advertisement) Teleport-* 11:12 - Send Proxmox Metrics to InfluxDB2 14:10 - Visualize Metrics in Grafana ________________ All links with "*" are affiliate links.
You May Also Like


Origami Starter Kit Essentials
AI-recommended products based on this video

Amazon Basics Ultra Paper Bowls, 20 Oz, Disposable, 50 Count, White (1 pack of 50)

Bounty Quick Size Paper Towels, White, 8 Family Rolls = 20 Regular Rolls (Packaging May Vary)
