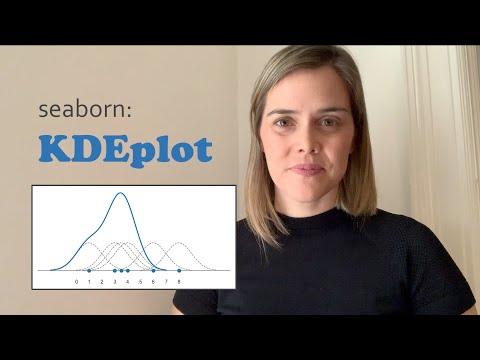
What is kernel density estimation? And how to build a KDE plot in Python? | Seaborn KDEplot

Kimberly Fessel
View ChannelAbout
Welcome to my channel! This channel features videos about Python, data visualizations packages, and visual explanations of plots and metrics. You can watch my full "Introduction to Seaborn" playlist, check out some specific Matplotlib tips, learn about Pandas, or see other visual interpretations of data concepts. To see more from some of my favorite learning resources, check out my Amazon storefront: https://www.amazon.com/shop/kimberlyfessel And if you have found my videos and code useful and you are in a position to do so, please consider buying me a cup of coffee: https://www.buymeacoffee.com/kimberlyfessel Your support signals the importance of this channel and helps encourage me to make more content -- THANK YOU! My company, Dr Kim Data, specializes in data handling, machine learning, and data education. Feel free to contact me by email with business opportunities. Thanks for stopping by and let me know what type of content you would like to see next -- cheers!
Latest Posts


Video Description
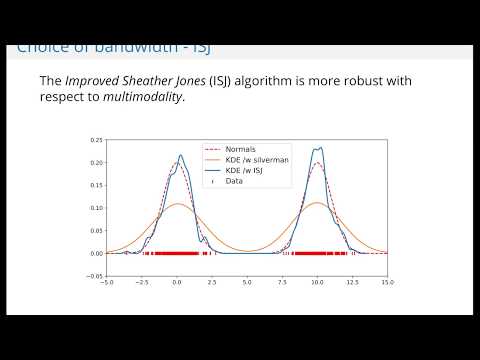
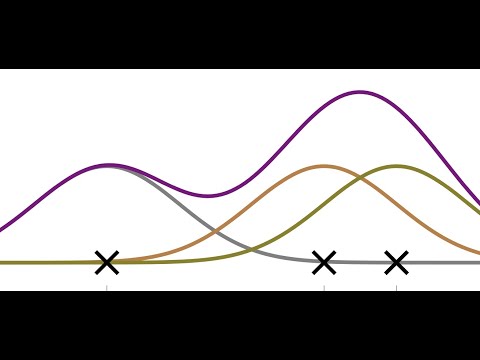
This seaborn kdeplot video explains both what the kernel density estimation (KDE) is as well as how to make a kde plot within seaborn. After introducing how a KDE plot is built, I demo Python code for both the univariate and bivariate KDE plots with seaborn. I also discuss what kinds of kernel to choose and how to set bandwidth. 00:00 What is KDE? 1:03 How does KDE work? 2:05 Univariate KDEplot code 4:02 What is bandwidth? 5:35 How to read a bivariate KDEplot 6:09 Bivariate KDEplot code 8:34 Conclusion and up next Github code: https://github.com/kimfetti/Videos/blob/master/Seaborn/02_KDEplot.ipynb #seaborn #dataviz


Essential Data Visualization Tools
AI-recommended products based on this video
