Machine Learning with Python in Excel: Best of Both Worlds? (full tutorial!)

Maven Analytics
@mavenanalyticsAbout
We empower everyday people and teams with future-proof data & AI skills. We've helped 2M+ people build job-ready data literacy & AI skills, master tools like Excel, SQL, Power BI, Tableau and Python, and build the foundation for successful careers. Start learning for free at www.mavenanalytics.io


Video Description
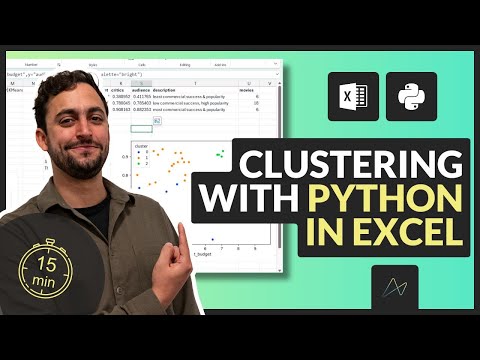
Learn to combine Excel’s hands-on nature with Python’s machine learning capabilities to get the best of both worlds with Python in Excel. In this demo, you’ll learn how to fit, interpret, and visualize a K-Means Clustering model in an Excel workbook with less than 15 lines of Python code. Along the way, you’ll use Python in Excel to: ✔️ View column distributions using pair plots ✔️ Scale data using normalization ✔️ Find the right number of clusters using inertia plots ✔️ Fit a K-Means clustering model ✔️ Interpret the cluster centers ✔️ Visualize the clusters to share your insights …all in less than 20 minutes! 📆 Coming Soon: January Jumpstart 2026! 📆 Join us January 5th - 16th to jumpstart the new year with LIVE instructor-led learning sessions and FREE course access to our top career & AI learning paths. Let’s make AI your new data superpower in 2026! REGISTER NOW 👉 https://bit.ly/4oX9MkO 🔗 Helpful links: 👉 Downloadable project file: https://drive.google.com/drive/folders/1WGDRIzcq0nqqErNOmM4DBjoMl-G2hvCb?usp=sharing 👉 Full Unsupervised Learning course: Maven Analytics: https://bit.ly/4eLsOX6 Udemy: https://bit.ly/3Y4y1lT 👉 10-Week Immersive Programs: https://bit.ly/3AceEzc 👉 Follow us on LinkedIn: Enrique: https://www.linkedin.com/in/enrique-ruiz-tapia/ Maven Analytics: https://www.linkedin.com/company/maven-analytics ⏱️ Timestamps: 00:00 - Intro 00:15 - Excel + Python 00:45 - Marvel Movie Dataset 00:56 - Step 1: Start with a question 01:11 - Step 2: Select the right method 01:34 - Step 3: Select the right features 03:24 - Step 4: Scale the data 05:54 - Step 5: Find the right number of clusters 09:13 - Step 6: Fit the model 10:11 - Step 7: Interpret the cluster centers 12:33 - Step 8: Share your insights 15:35 - Resources and next steps Maven Analytics is an award-winning online platform for data professionals to learn new skills, showcase their work, and connect with peers around the world. We've helped more than 1,000,000 students build job-ready data & AI skills, master tools like Excel, SQL, Power BI, Tableau and Python, and build the foundations for successful careers. Start learning and build your FREE portfolio at http://www.mavenanalytics.io/


Essential ML Tools for Excel Gurus
AI-recommended products based on this video

Freenove Ultimate Starter Kit for BBC micro bit (V2 Included), 316-Page Detailed Tutorial, 225 Items, 44 Projects, Blocks and Python Code

Open Office Suite 2024 Professional Edition CD DVD 100% compatible with Microsoft® Word® and Excel® for Windows 10, 8, 7, Vista, XP And Mac OS X

It's Not Easy Being a Bunny: An Early Reader Book for Kids

Little Blue Truck's Springtime: An Easter And Springtime Book For Kids – An Interactive Adventure with Baby Animals

Happy Easter, Little Critter (Little Critter): An Easter Book for Kids and Toddlers

Happy Valentine's Day, Mouse!: A Lovely Valentine's Day Book for Kids (Ages 4-8)

ELECROW 8 Inch Portable Monitor, 1280x800 Mini HD Display with Built-in Speakers, USB Powered, Non-Touch LCD Screen for Raspberry Pi, PC, Laptop, Jetson Nano, Game Consoles

7 Inch Portable Monitor Touchscreen HD 1024x600 LED Display Dual HDMI Port Small Monitor for PC Raspberry Pi Laptop Computer Xbox PS4/5 Switch Built-in Speakers

BrosTrend 1800Mbps WiFi 6 Linux WiFi Adapter for PC and Raspberry Pi 2+, Long Range USB WiFi Dongle Linux for Ubuntu, Mint, Debian, Kubuntu, Lubuntu, Zorin, Windows 11/10, Dual Band Wireless Antenna
